Urban Traffic Prediction through the Second Use of Inexpensive Big Data from Buildings
Efforts to measure mobility in cities though mining increasingly available urban data are hindered by fragmented and purpose-specific data sources. Synthesizing disparate data sources to learn transportation network behavior is essential to more accurately simulate the consequences of changes in policy or in the built environment. In this paper1 Zheng et. al. show that building occupancy data estimated from existing building sensor can improve the accuracy of traffic speed predictions. More impressively, they show that occupancy data alone can predict traffic as well as dedicated traffic monitoring systems for a fraction of the cost.
Traffic prediction research
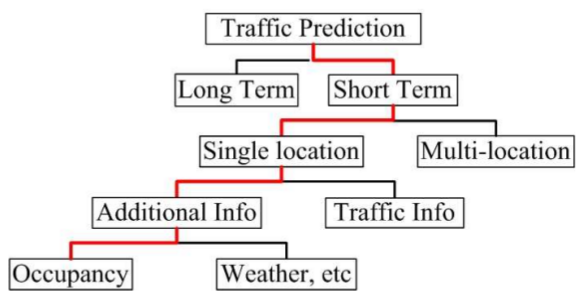
Taxonomy of traffic prediction research (figure 2)
Broadly, traffic prediction research aims to predict the traffic status of a road or road network and is an essential tool in developing and assessing congestion reduction strategies. With estimates of the annual cost of congestion in the US well in excess of $100 billion and rising, reducing congestion is a priority in almost every city.
Within the research area of short-term single location traffic prediction, external information is often used along with historical traffic data to improve prediction accuracy. Weather and weekday/holiday information are popular candidates because their influence on traffic is not recoverable from the traffic data itself. However, external data is often not sufficient to replace the historical traffic data in the predictive model. Importantly, Zhang et.al. show that occupancy data alone can predict traffic status after a calibration period.
Occupancy sensing in buildings is an area of research in its own right. Buildings can more efficiently regulate systems like HVAC when the occupancy of the building or individual rooms is known. Like traffic, measuring occupancy directly is hard and several methods for estimating occupancy from sensor measurements have been developed. The authors selected CO2 concentration as an occupancy because it is widely available as part of ventilation management systems and well-correlated with occupancy.
Occupancy-based traffic prediction framework
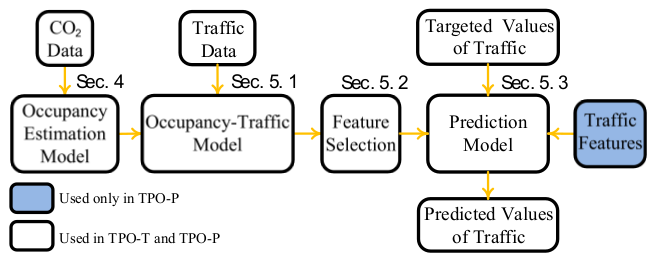
The traffic prediction framework (figure 4)
The prediction framework encompasses two run-time modes: prediction with a permanent traffic sensor (TPO-P) and prediction with a temporary traffic sensor (TPO-T). Both modes require traffic data during the training phase, but only TPO-P requires traffic data in the prediction phase.
Estimating occupancy in each zone
First, CO2 concentration is converted into occupancy using a time-varying Occupancy Estimation Model (OEM). The model is a dynamic extension of a steady-state formula used by the American Society of Heating, Refrigeration and Air Conditioning Engineers (ASHRAE). The authors introduce the model fully in a previous paper2 but the take-home message is that ventilation standards require the system to circulate enough air to keep CO2 concentration below an acceptable level. CO2 concentration in buildings is primarily a function of occupancy, so the authors were able to reverse engineer measurements already being collected to estimate occupancy.
Relating changes in occupancy to changes in traffic
Changes in occupancy don’t immediately result in changes in traffic. Moreover, the delay between changes in occupancy and changes in traffic itself may change over time. To solve this, the authors apply a modified Dynamic Time Warping (DTW) algorithm to map changes in occupancy to changes in traffic through time. These time-warp offsets compose the Occupancy-Traffic Model in the framework diagram.
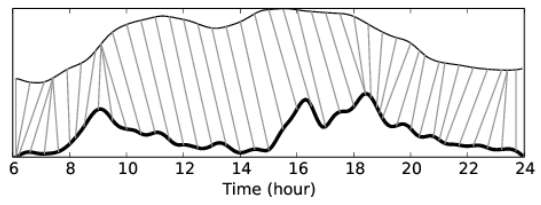
An example time warp map between occupancy (top line) and traffic speed (bottom line) (figure 7)
The training phase in both TPO-T and TPO-P has access to traffic information, but this information will clearly not available for the time being predicted. To solve this, a Kernel Average (KA) algorithm is applied to create a similarity-weighted average of the time-warp offsets from the training phase. Based on the intuition that days with similar occupancies will have similar traffic, the Kernel Average algorithm weights days from the training set by similarity to the current day. Time-warp offsets for the prediction window are built from the weighted contributions of the time-warp offsets from the training set.
Selecting important time slots and zones
Changes in occupancy at different times and different zones of the building have variable impact on the traffic status. Some zones, for example, may contain a large contingent of public transit riders whose commute has a much smaller impact on traffic than the commutes of those who drive. Using occupancy data from times and zones with the greatest impact on traffic reduces prediction error caused by over-fitting during the training phase.
The most important time slots are selected using Lasso, a common technique in statistics and machine learning to encourage sparse coefficients. Lasso works by jointly minimizing an error term (mean squared error in linear regression) and a regularization term, 3. The 1-norm of the coefficient vector will tend to push many coefficients to zero, effectively selecting only a few important coefficients.
The most important zones are selecting by recursively eliminating irrelevant zones. As the name implies Recursive Feature Elimination (RFE) iteratively removes features based on an importance weight assigned to it by the predictor. Here, the authors simply use prediction accuracy of each zone to remove zones that do not contribute to the predictive power of the model.
Predicting traffic speed
Once the most important zone-time features have been extracted, the prediction model uses Locally Weighted Linear Regression (LWR) to predict traffic. LWR retains the simplicity and interpretability of linear regression with the expressiveness of a more complex model. It achieves this by first weighting each point in the training set by its similarity to the test point. Then during fitting, the residual at each point is multiplied by its weight. As a result, the line of best fit will focus on predicting points near the test point and ignore those further away.4 In TPO-P the features are the occupancy features and the corresponding traffic information and in TPO-T the features are just the occupancy features.
Evaluating the model
TPO-P outperforms both Google maps traffic predictions and the prediction of the traffic sensor alone and TPO-T performs as well as the traffic sensor predictions. To test their model, the authors collected four months of occupancy data from a large office building in Hong Kong and traffic data from a nearby roadway. During the latter half of the day we intuitively expect changes in occupancy to be a leading indicator of traffic, as workers leave the building to begin their commute. However, during the morning we expect the opposite: workers enter the building to end their commute. In the morning we would therefore expect occupancy to be a lagging indicator of traffic. It would be interesting to see if this phenomenon is evident in the time-warp offsets over the course of the day and how this affects the prediction accuracy.
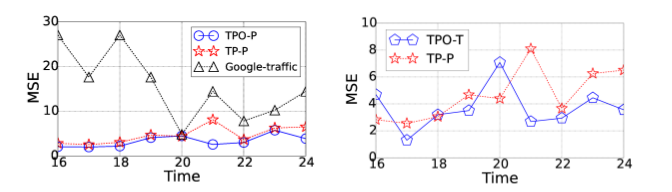
At left, the prediction accuracy of TPO-P compared with Google Maps traffic and the traffic sensor alone (figure 9). At right, the prediction accuracy of TPO-T compared with the traffic sensor alone (figure 17).
What’s next
During the evening at least, building occupancy predicts traffic speed as well as traffic monitoring systems can for less than 30% of the cost. Portable traffic sensors can be deployed on a rotating subset of the roadways to train TPO-T on nearby building occupancies. Once trained, these portable sensors can be re-deployed to train new areas. This strategy offers significant cost savings over the set up and maintenance of permanent traffic sensors.
Since the model uses occupancy data from multiple zones in a building, it trivially extends to occupancy data from multiple buildings. Predicting the traffic state of multiple roadways, however, is accomplished by predicting each road independently. An interesting extension would be explicitly model the relationships between roadways, potentially through multi-task learning5, to improve the prediction accuracy on the network.
Alternatively, buildings might be modeled as a network as well. If office buildings are lagging indicators of traffic in the morning and leading indicators in the evening, then residential towers are leading indicators in the morning and lagging indicators in the evening. Exploiting dependencies between buildings through the road network could additionally improve traffic predictions.
Cities are producing vast amounts of data; much of which is only ever used within the system it was designed to measure. But the behavior of cities, and transportation networks especially, emerge from interactions of many urban systems. This paper demonstrates the value internal data to external systems and is an example of how theoretical models and machine-learning techniques can be applied in tandem to better measure urban mobility.
Shout Outs
- Adrian Colyer over at the morning paper for the inspiration to try something like this.
- Dr. Jennifer Raff for this helpful guide which served as the structural template for this post.
References
-
Zheng, Z., Wang, D., Pei, J., Yuan, Y., Fan, C., & Xiao, F. (2016). Urban Traffic Prediction through the Second Use of Inexpensive Big Data from Buildings. In Proceedings of the 25th ACM International on Conference on Information and Knowledge Management - CIKM ’16 (pp. 1363–1372). https://doi.org/10.1145/2983323.2983357. pdf. ↩
-
Sun, Z., Wang, S., & Ma, Z. (2011). In-situ implementation and validation of a CO2-based adaptive demand-controlled ventilation strategy in a multi-zone office building. Building and Environment, 46(1), 124–133. https://doi.org/10.1016/j.buildenv.2010.07.008. ↩
-
For a deeper dive, see these lecture notes from the Statistical Machine Learning course here at CMU ↩
-
For a deeper dive with an overview of local and global learning, see this webpage from UPenn ↩